Database Observability: Proactive Query Performance Management
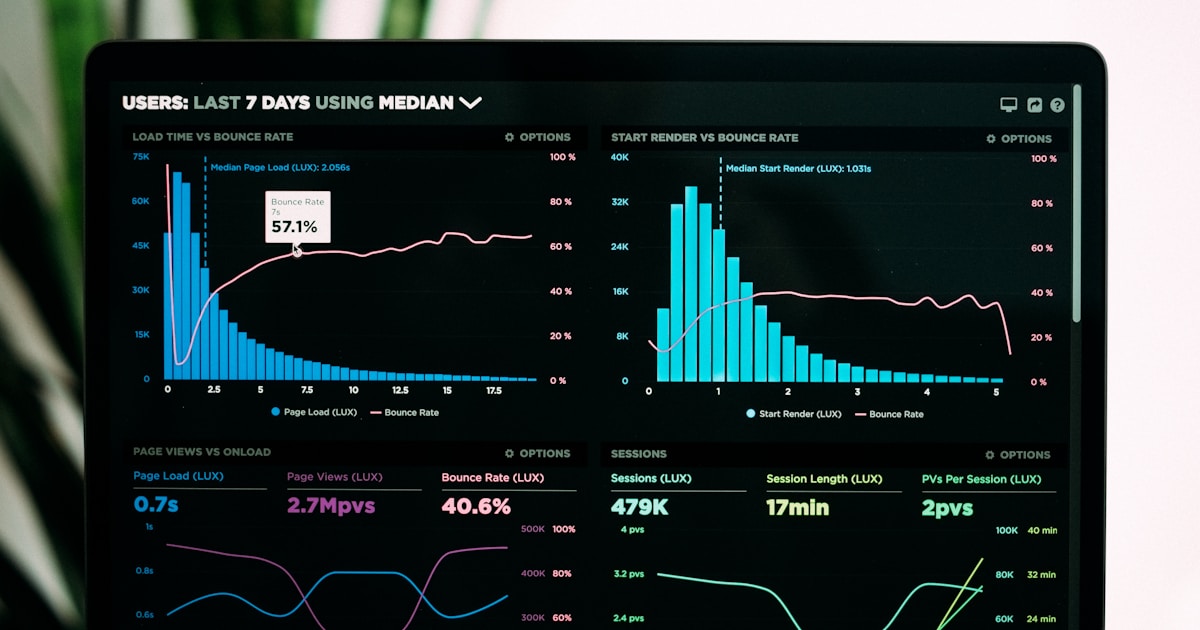
Database observability query performance monitoring transforms reactive troubleshooting into proactive optimization by providing continuous visibility into query execution patterns. Therefore, teams identify performance regressions before they impact users rather than responding to production incidents. As a result, database-driven applications maintain consistent response times even as data volumes grow.
The difference between monitoring and observability is worth stating plainly. Monitoring answers questions you already knew to ask, such as “is CPU above 80%.” Observability lets you ask new questions of the data after the fact, such as “which query started reading twice as many buffers after last Tuesday’s deploy.” Consequently, the goal is not just dashboards but a rich, queryable history of how every statement behaves over time.
Query Performance Baselines
Establishing performance baselines using pg_stat_statements captures query execution metrics including mean time, calls, and row counts. Moreover, tracking these metrics over time reveals gradual performance degradation caused by data growth or schema changes. Consequently, anomaly detection on query metrics provides early warning before users experience latency.
The combination of total time and call frequency identifies both slow individual queries and frequently executed queries with small per-call impact. Furthermore, monitoring shared buffer hits versus disk reads reveals caching effectiveness.
A subtle but critical point: optimize by total time, not by mean time. A query averaging 800 milliseconds that runs twice a day matters far less than a 4-millisecond query executed two million times an hour, yet a naive “slowest query” sort hides the latter entirely. Therefore, the toolkit below ranks by total_exec_time, which surfaces the queries actually consuming the database’s capacity. In addition, the cache-hit percentage column tells a second story: when a hot query’s hit ratio drops, the working set has outgrown shared_buffers, and the fix is often a configuration change rather than a query rewrite.
Index Optimization Analysis
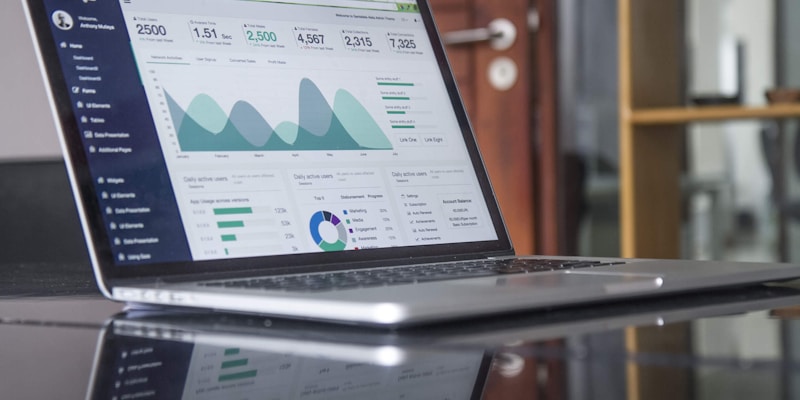
Unused index detection saves storage and write amplification overhead, while missing index identification eliminates sequential scans on large tables. Additionally, partial indexes and covering indexes provide targeted optimization for specific query patterns. For example, a partial index on active orders reduces index size by 90% compared to a full table index.
-- Database observability query performance toolkit

-- Find top 20 slowest queries by total time
SELECT
    queryid,
    calls,
    round(total_exec_time::numeric, 2) as total_ms,
    round(mean_exec_time::numeric, 2) as avg_ms,
    round((100.0 * shared_blks_hit / nullif(shared_blks_hit + shared_blks_read, 0))::numeric, 2) as cache_hit_pct,
    rows,
    substring(query, 1, 80) as query_preview
FROM pg_stat_statements
WHERE calls > 10
ORDER BY total_exec_time DESC
LIMIT 20;

-- Detect unused indexes wasting resources
SELECT
    schemaname || '.' || relname as table_name,
    indexrelname as index_name,
    pg_size_pretty(pg_relation_size(i.indexrelid)) as index_size,
    idx_scan as times_used,
    idx_tup_read as tuples_read
FROM pg_stat_user_indexes i
JOIN pg_index USING (indexrelid)
WHERE idx_scan = 0
  AND indisunique IS FALSE
  AND pg_relation_size(i.indexrelid) > 1024 * 1024  -- > 1MB
ORDER BY pg_relation_size(i.indexrelid) DESC;

-- Missing index suggestions based on sequential scans
SELECT
    schemaname || '.' || relname as table_name,
    seq_scan as sequential_scans,
    seq_tup_read as rows_scanned,
    idx_scan as index_scans,
    pg_size_pretty(pg_relation_size(relid)) as table_size,
    round(100.0 * idx_scan / nullif(idx_scan + seq_scan, 0), 1) as index_usage_pct
FROM pg_stat_user_tables
WHERE seq_scan > 100
  AND pg_relation_size(relid) > 10 * 1024 * 1024  -- > 10MB
ORDER BY seq_tup_read DESC
LIMIT 15;
Automated index advisory tools like Dexter or HypoPG suggest optimal indexes based on actual workload analysis. Therefore, index optimization becomes data-driven rather than intuition-based.
Two caveats keep this from going wrong. First, the unused-index query reads idx_scan = 0 from statistics that reset on restart or manual pg_stat_reset(), so a “zero scans” index might simply be young; always confirm against a window of several weeks before dropping anything. Second, a high sequential-scan count is not automatically bad. On a small lookup table that fits in memory, a sequential scan is faster than an index probe, and the planner knows it. The signal to act on is a large table with many sequential scans reading millions of rows, which is exactly what the size and seq_tup_read filters isolate. When you do add an index, prefer a covering index with INCLUDE columns so the query can be satisfied index-only, avoiding the heap fetch entirely.
Connection Pool Monitoring
PgBouncer and PgCat connection poolers require their own observability to prevent connection exhaustion. However, pool metrics must be correlated with application-level request patterns to identify the root cause. In contrast to database-level monitoring alone, end-to-end observability connects slow queries to user-facing latency.
The metric that predicts outages is the wait on cl_waiting in PgBouncer’s SHOW POOLS output: clients queued because no server connection is free. When that number climbs, the database is not necessarily slow; instead, the pool is undersized or a long transaction is holding a connection hostage. Transaction-mode pooling multiplies the apparent connection count, letting hundreds of clients share a few dozen backend connections, but it forbids session-level features like prepared statements unless configured carefully. Therefore, correlating pool wait time with the slow-query list above is what turns a vague “the app is slow” report into a precise root cause, such as “one analytics query holds a connection for eight seconds and starves the checkout path.” The Database Connection Pooling Guide covers tuning these pool sizes in depth.

Alerting and Dashboards
Grafana dashboards with Prometheus metrics from postgres_exporter provide real-time database health visibility. Additionally, alert thresholds on query latency percentiles (p95, p99) catch performance regressions early.
Effective alerting rests on percentiles and rates, not raw counters, because an absolute number means little without context. The PromQL below tracks the proportion of buffer reads served from cache and the rate of deadlocks, two signals that reliably precede user-visible pain.
# Cache hit ratio across all databases (alert if it falls below 0.95)
sum(rate(pg_stat_database_blks_hit[5m]))
/
(sum(rate(pg_stat_database_blks_hit[5m])) + sum(rate(pg_stat_database_blks_read[5m])))

# Deadlocks per second over the last 5 minutes
sum(rate(pg_stat_database_deadlocks[5m]))

# Replication lag in bytes (alert when a replica drifts too far)
pg_replication_lag_bytes
Crucially, alert on symptoms users feel rather than on every internal threshold, or the on-call rotation drowns in noise and learns to ignore the pager. A good rule of thumb is to page on sustained p99 latency breaches and on cache-hit collapse, while routing slower-burning signals like creeping table bloat to a daily review instead. For the query-rewriting side of the problem, the SQL Query Optimization PostgreSQL guide complements this monitoring approach.

Related Reading:
- SQL Query Optimization PostgreSQL
- Database Connection Pooling Guide
- PostgreSQL 17 New Features Guide
Further Resources:
In conclusion, comprehensive database observability query performance practice transforms query performance management from reactive firefighting into proactive optimization. Therefore, implement continuous monitoring, baseline every statement, and alert on the symptoms users actually feel to maintain consistent database performance at scale.